
Built on Oliver · Observability

The platform is theirs. The engine is ours.

Trillo ships three production observability platforms on OliverDB — for GPU fleets in private data centres, for the neoclouds that rent GPUs out, and for fleets of AI agents. Same engine underneath all three, holding the metrics, logs, traces and events together.

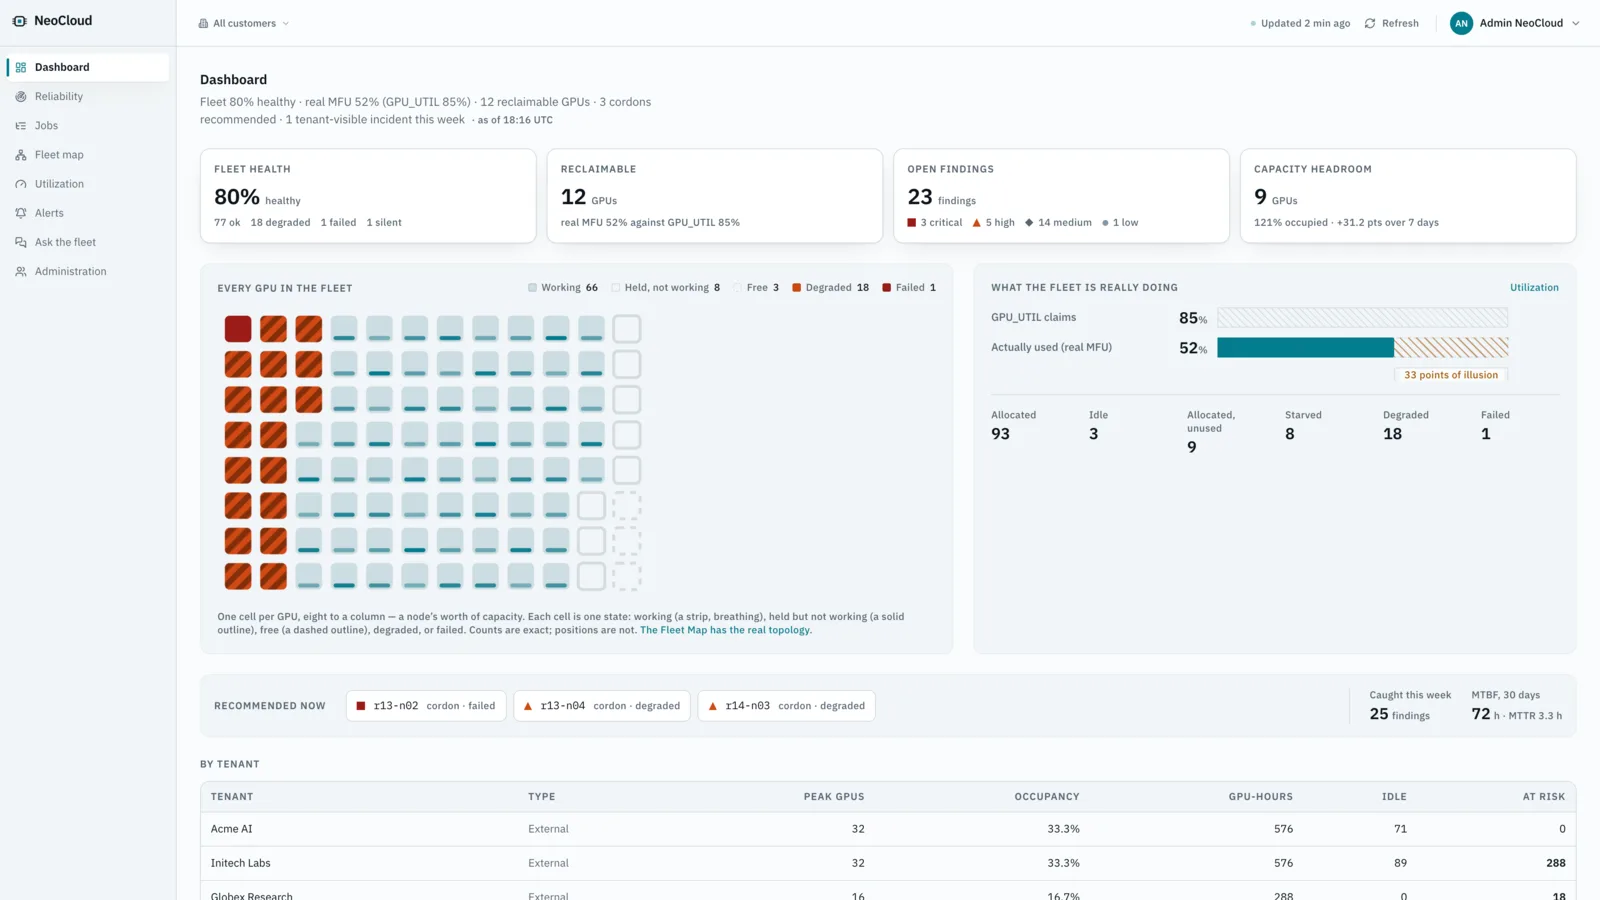
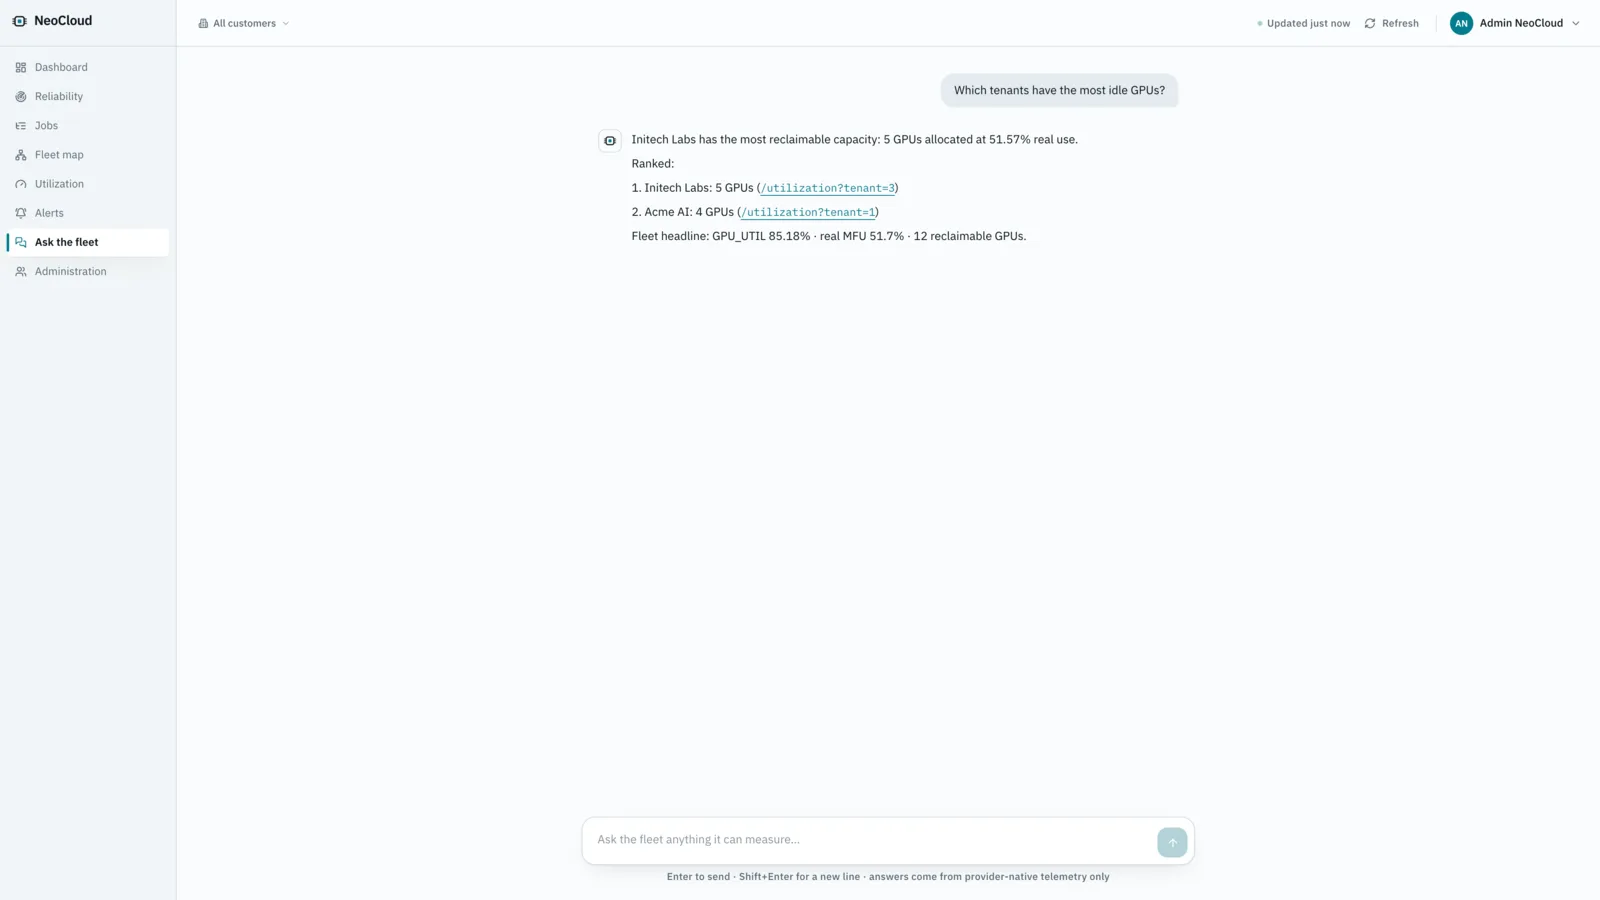
Neoclouds Every GPU in the fleet, one cell each
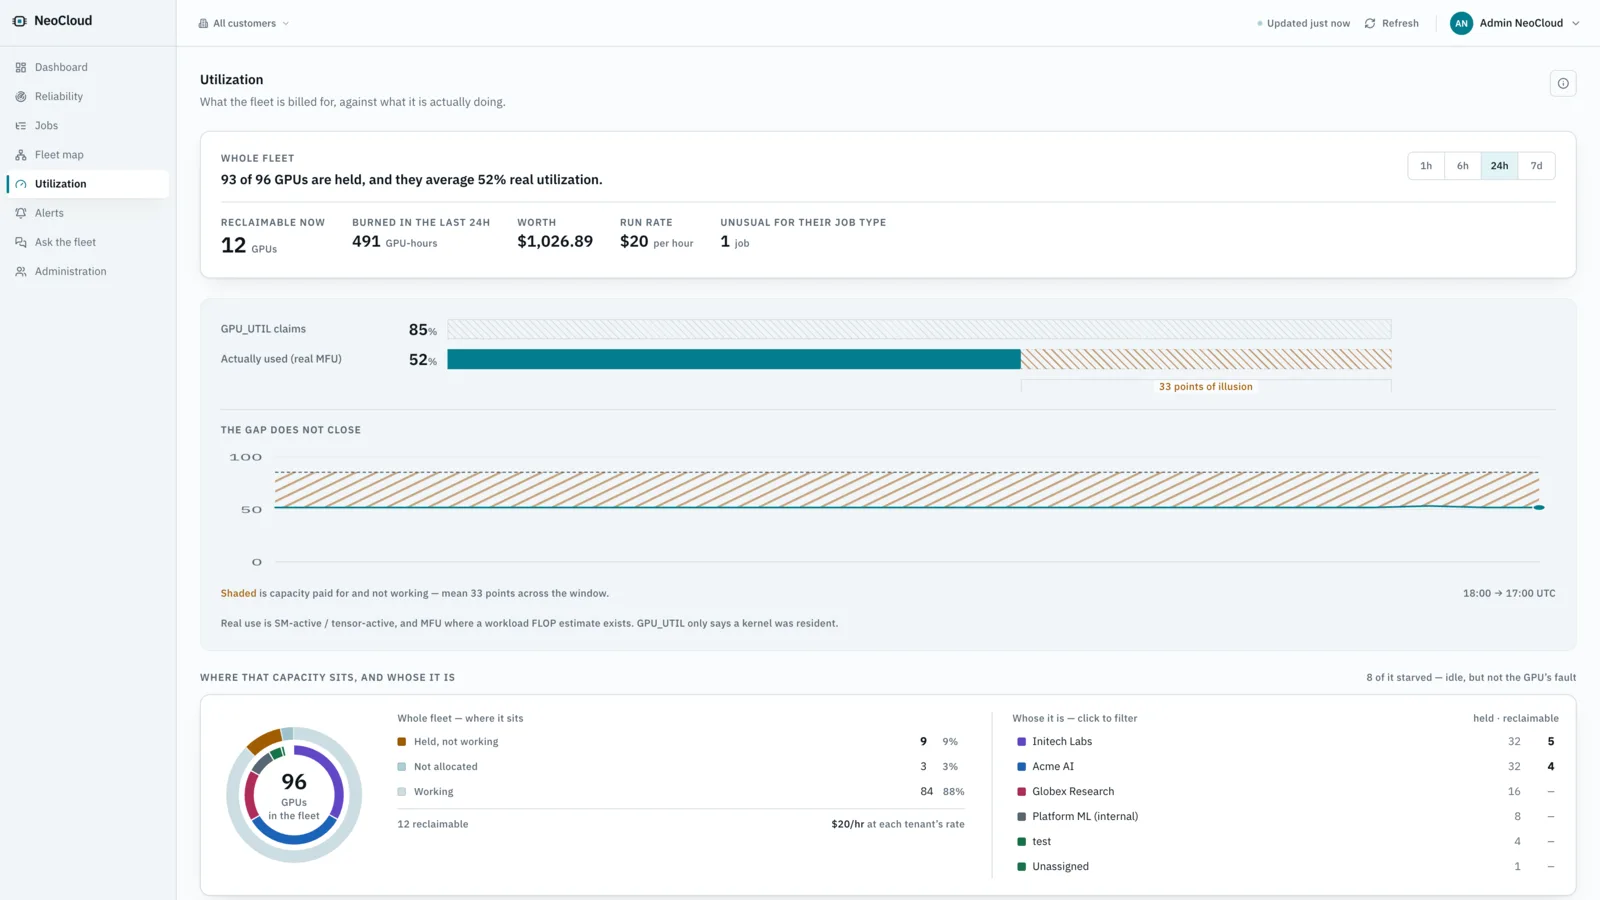
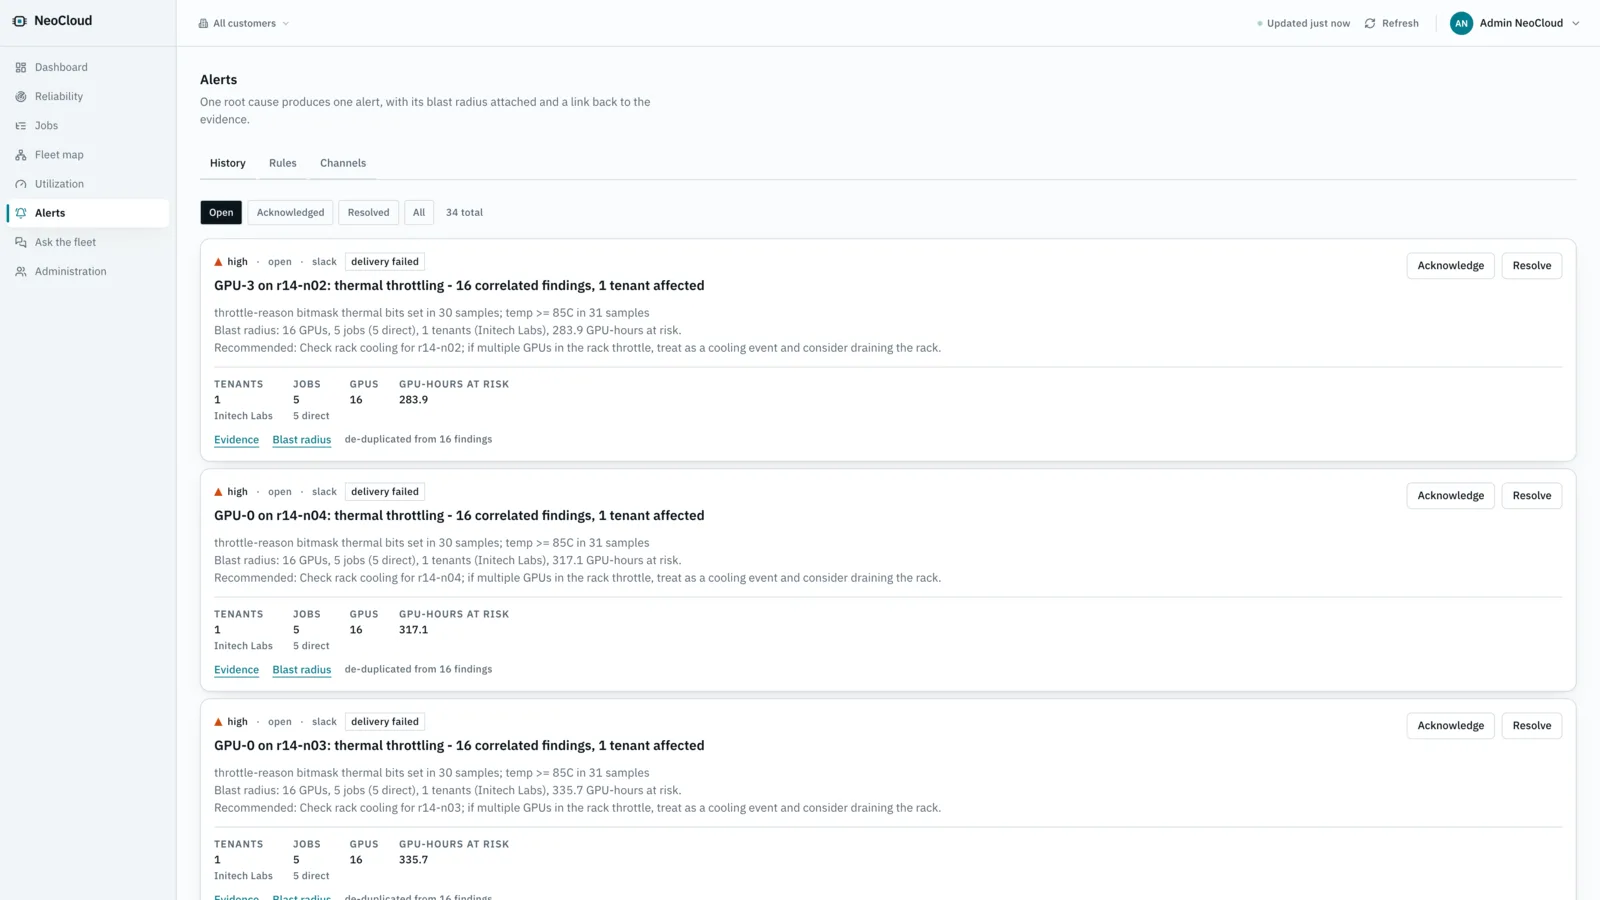
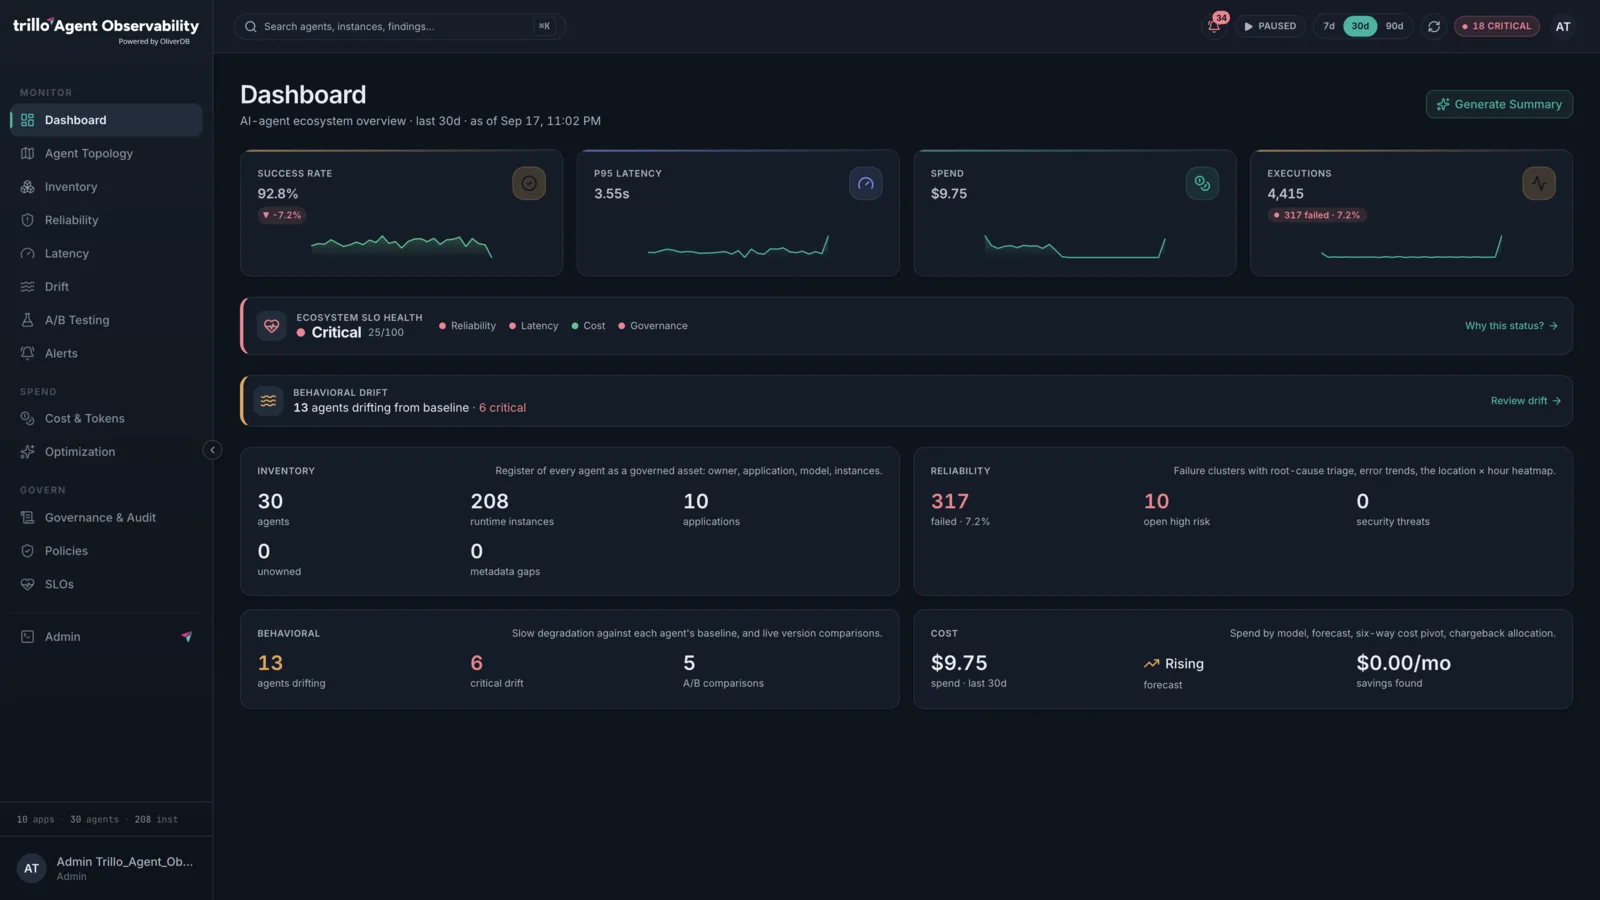
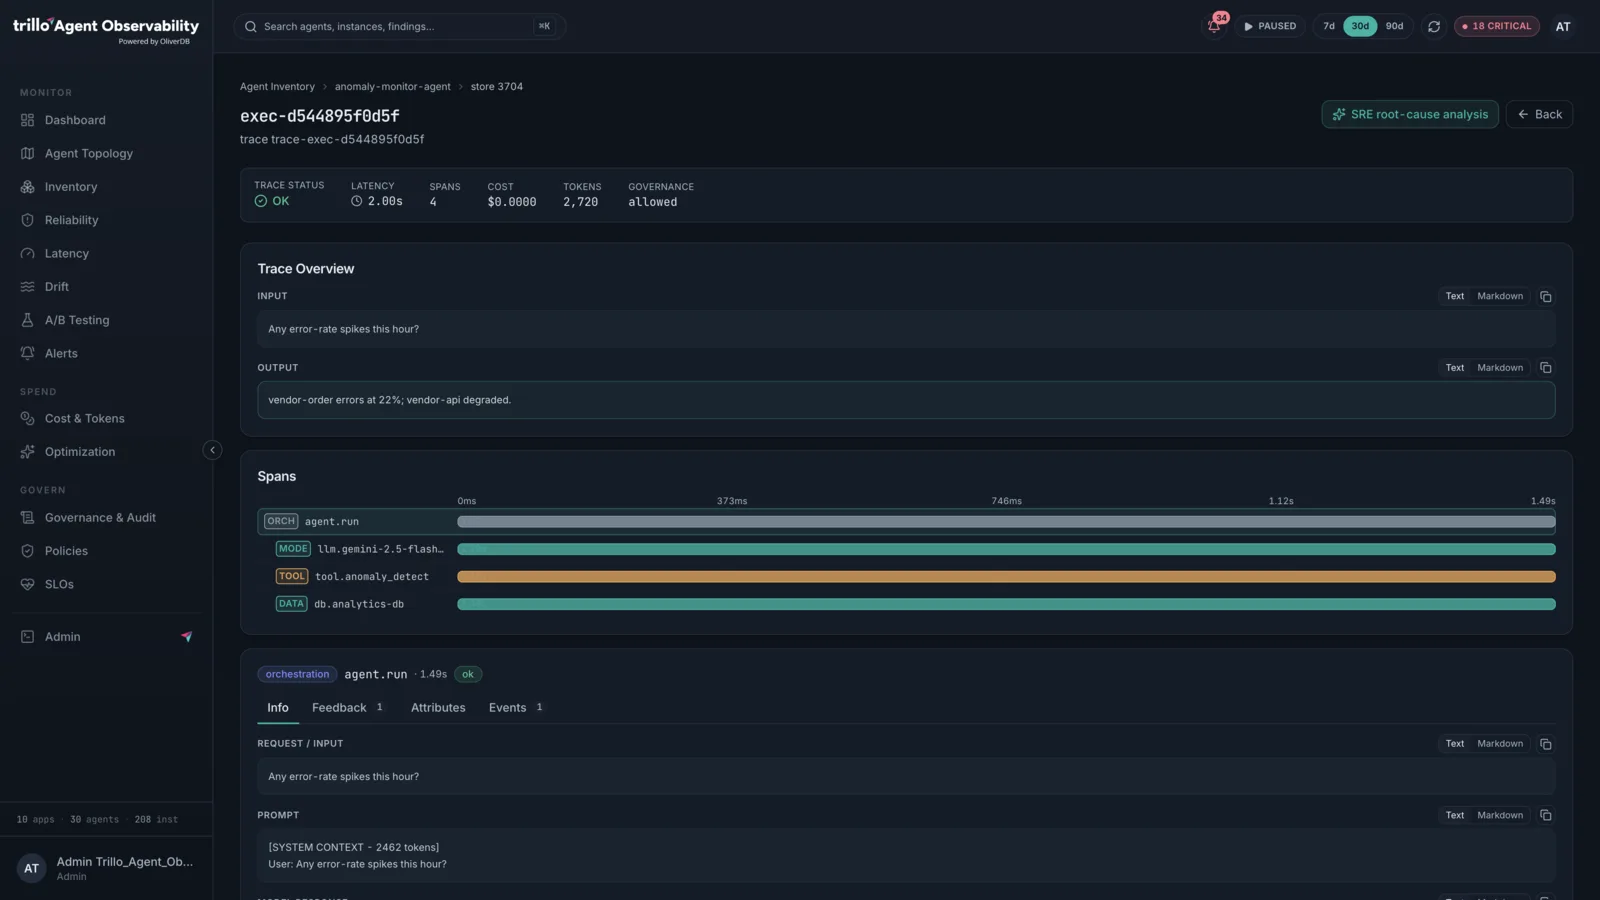
Neoclouds: Every GPU in the fleet, one cell each Neoclouds: Claimed utilisation, against real Neoclouds: A failing card, its blast radius, and what to do Neoclouds: Ask the fleet anything it can measure Agent fleets: Reliability, latency and spend across the fleet Agent fleets: One run, span by span, with what it cost
The neocloud screens are the same platform, white‑labelled by the provider running it.
Three platforms, one engine

Different fleets. The same telemetry problem.

Each one asks a different question of the same firehose — and each one is better answered from everything you kept than from the part you could afford to keep.

service health · golden signals
all normal
cloud & services

The applications you ship

Services, containers, and the cloud underneath them. The everyday questions — asked against everything you kept, rather than the slice you could afford to keep.

  • What broke, and which customers felt it
  • What changed in the minutes before it broke
  • Which dependency is actually the slow one
  • What your telemetry costs, by team and by service
OpenTelemetry · Kubernetes · cloud metrics · logs and traces
fleet occupancy · live
idle right now
private cloud

GPUs in your own data centre

You bought the hardware. The question is whether it is working, who is holding it, and what it costs you when it sits still.

  • Which cards are idle — and the money that idleness is burning
  • Which team or project to charge for the capacity they hold
  • Which training run a failing GPU is about to take down
  • Whether to buy more cards or just schedule the ones you have
DCGM · node & fabric exporters · Xid / ECC / thermal · on‑premise, air‑gap capable
blast radius · by tenant
watching
neoclouds

GPUs you rent to tenants

Your margin is occupancy and your reputation is uptime. Both are decided by telemetry you either have at full resolution or do not have at all.

  • Which cards sit idle, and the revenue leaking with them
  • Which tenants a failing card or fabric link just took out
  • GPU‑hours per tenant, metered well enough to bill and defend
  • How tight you can pack before the next buildout
per‑tenant metering · NVLink / InfiniBand / RoCE · oversubscription headroom
one agent run · spans
this run
agent fleets

The AI agents you run

An agent run is a tree of model calls, tool calls and retrievals. Without the tree you are guessing at why it failed and what it cost.

  • Why a run failed, and how many users it touched
  • Where the latency actually went — model, tool or retrieval
  • Token spend by application, agent, model and cost centre
  • Which policy version governed a decision, with evidence to export
OpenTelemetry · model & token economics · versioned policy · audit trail
What it costs to keep

Keep everything. Ask anything.

Every observability bill is really a list of things you agreed to stop keeping. Oliver’s economics let you stop agreeing.

The usual trade On Oliver
Metrics Drop labels to keep cardinality under control Every label you want
Traces Keep one in a hundred, and hope All of them
Logs Thirty days, then archived somewhere you cannot search Kept, and still searchable
metrics

Every label you want

Label things the way your team actually thinks about them — pod, customer, request, region. Containers can churn all day and mint new series doing it. That is a normal Tuesday, not a capacity incident.

traces

All of them, not one in a hundred

No head sampling. Every trace is kept, and finding the one you want among all of them is a lookup rather than a hunt — so “did we happen to keep that one?” stops being a question anyone has to ask.

logs

Old and searchable are not opposites

Cooling off into cheap storage does not mean leaving your search behind. Full‑text search still works on logs that have aged out, so nothing disappears into an archive you can only restore from.

You drop bytes, never dimensions. Keep years of the shape and days of the detail, set per signal — because the label you didn’t drop is the one the incident turns out to be about.
Where we sit

Standard exporters in. An application on top.

No proprietary agents anywhere in the path. Telemetry arrives over OpenTelemetry, Oliver resolves whatever shape it is on the way in, and the application queries it.

All of it inside the customer’s own environment — on‑premise, air‑gapped, or their own cloud account.
PromQL & Grafana

Point Grafana at it. Change nothing.

OliverDB answers the Prometheus API. The dashboards, alert rules and variables your team already wrote keep working — now against an engine that holds your logs, traces and events too, under the same key and the same policy as everything else.

Grafana → add a data source
TypePrometheus
Server URLhttps://oliver.your‑company.com the only edit
Authenticationyour API key
✓ Successfully queried the Prometheus API
Everything carries over
  • Every dashboard panel you already have
  • Alert rules, evaluating and firing
  • Template variables, populated from your labels
  • Metric browsing and ad‑hoc queries in Explore
  • Exact counter math for rate and increase, at every resolution
Verified against Prometheus itself — query for query, point for point.
Why it runs on Oliver

What a platform needs from the layer underneath it.

one engine

Four signals, one store

A failing card’s metrics, the job’s logs, the fabric events and the agent’s traces are one query, not four products stitched together after the fact.

resolution

Keep it all, not a sample

Retention and placement are set per resolution, so raw samples can age into object storage while the rollups that serve the long charts stay local. Nothing has to be thrown away to stay affordable.

alerting

The whole rule book, every minute

Batch execution fuses every rule into a single pass over the data, so “every rule against every card” is one read rather than one read per rule.

scale

Fleet-sized from the start

Ten thousand cards at forty metrics each is four hundred thousand points a second. Series tables hold hundreds of thousands of live series per node and add capacity without a rebalancing window.

tenancy

Isolation that travels with the key

Every key carries a policy compiled into the query itself — the difference between a provider’s view and a tenant’s is enforced before a query runs, not filtered afterwards.

agents

Safe to hand to an investigator

Their AI copilot investigates the fleet conversationally over MCP. The same policy that scopes a dashboard scopes the agent asking questions about it.

Trillo builds all three on OliverDB.

Model‑driven platforms that deploy into the customer’s own environment: fleet health and topology, reliability and blast radius, utilisation, metering and chargeback, governance and audit, and an AI investigation copilot. Available today.

trillo.ai

Building a platform? Build it on Oliver.

If your product is only as good as the telemetry layer under it, we should talk.